1. Geomagnetic Activity at the Examined Time Points
The two flight events occurred close to each other in time; therefore, examining geomagnetic activity is also relevant,which is characterized, among other indicators, by the Kp index.
One of the most commonly used indicators of geomagnetic activity, as mentioned earlier, is the Kp index, which quantifies disturbances in the horizontal component of the Earth’s magnetic field. The scale ranges from 0 to 9, where lower values indicate quiet geomagnetic conditions, while values of 5 or higher represent geomagnetic storms.
2. The Kp Index
The Kp index is based on K indices determined by different geomagnetic observatories, which are calculated from magnetometer measurements. The K index characterizes the maximum fluctuation of the magnetic field observed within a three-hour interval.
For global comparability, researchers use the planetary Kp index, which represents the average of standardized K indices from multiple geomagnetic observatories located in mid-latitude regions.
The letter “K” originates from the German word Kennziffer, meaning “characteristic number.” The method was introduced by Julius Bartels in 1938, and the Kp index remains one of the most important indicators of geomagnetic activity today.
2.1. Interpretation of the Kp Index (Brief Overview)
The interpretation of the Kp index is as follows:
Table 1: Kp index ranges and their meaning
Source: GFZ Potsdam – Planetary Kp Index Archive, NOAA Space Weather Prediction Center
| Kp-index | Geomagnetic condition |
| 0–2 | quiet |
| 3–4 | moderate activity |
| 5+ | geomagnetic storm (NOAA G1–G5 range) |
Geomagnetic Activity on the Examined Days:
The examined flight events took place on two dates:
- June 7, 2024
- June 13, 2024.
The previously presented solar flare observed on June 8, 2024 is not directly related to a flight event but serves to illustrate the space weather environment of the examined period.
The geomagnetic environment was analyzed using archived Kp index data from GFZ Potsdam, which provide geomagnetic activity values in three-hour intervals.
Based on the available data, the geomagnetic conditions on the two days differed significantly.
Table 2: Daily maximum Kp index values at the examined time points
Source: GFZ Potsdam – Planetary Kp Index Archive, NOAA Space Weather Prediction Center
| Date | Maximum Kp value | Geomagnetic condition |
| Event 1 – 2024.06.07 | 6.3 | Geomagnetic storm |
| Event 2 – 2024.06.13. | 1.0 | Quiet |
The table clearly shows that on June 7, 2024, the Kp index exceeded 6 during the 12–18 UTC period, which corresponds to a geomagnetic storm according to NOAA classification.
In contrast, on June 13, 2024, geomagnetic activity remained around Kp ≈ 1, indicating a distinctly quiet geomagnetic state.
Regarding the previously presented solar flare observed on June 8, 2024, it is important to note that geomagnetic effects related to solar activity do not necessarily appear immediately but typically reach the Earth with a delay of several hours to even 1–2 days. Therefore, temporal shifts between solar events and geomagnetic conditions are natural, and the geomagnetic environment observed on a given day does not necessarily coincide directly with the timing of solar flares.
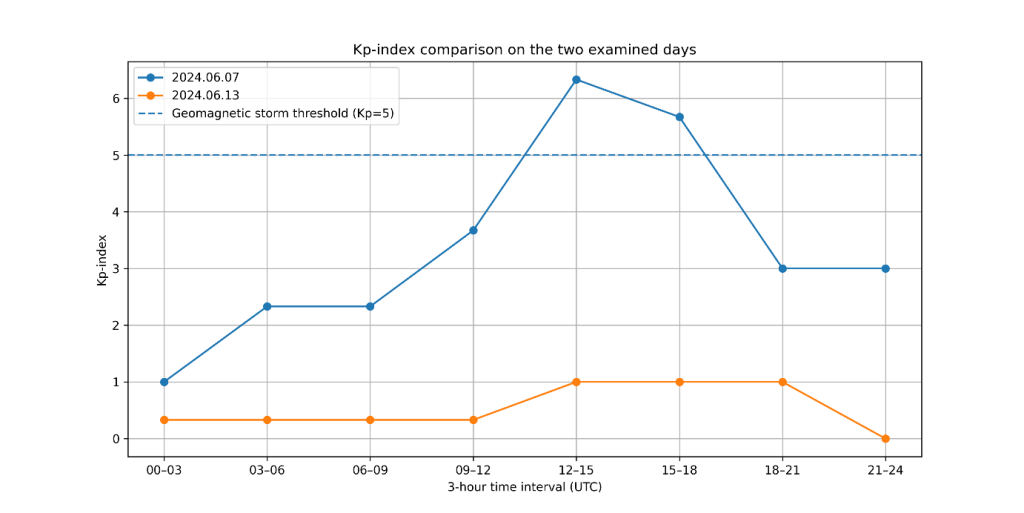
Figure 1: Comparison of Kp index values in three-hour intervals on June 7 and June 13, 2024
Source: own compilation based on GFZ Potsdam archived data
The diagram clearly illustrates that on June 7, 2024, geomagnetic activity increased significantly around midday, with Kp values exceeding 5 during the 12–18 UTC period.
For a more detailed comparison of geomagnetic activity on the two days, the three-hour Kp index values were analyzed.
Table 3: Three-hour Kp index values on June 7 and June 13, 2024
| Time (UTC) | Event 1: 2024.06.07 | Event 2: 2024.06.13 |
| 00–03 | 1.0 | 0.33 |
| 03–06 | 2.33 | 0.33 |
| 06–09 | 2.33 | 0.33 |
| 09–12 | 3.67 | 0.33 |
| 12–15 | 6.33 | 1.0 |
| 15–18 | 5.67 | 1.0 |
| 18–21 | 3.0 | 1.0 |
| 21–24 | 3.0 | 0.0 |
The table clearly shows how geomagnetic activity evolved throughout the day.
On June 7, 2024, Kp values increased steadily from 1.0 in the early hours to a maximum of 6.33 during the 12–15 UTC period. After this peak, activity decreased but remained elevated (5.67) during the 15–18 UTC period, and stayed around 3.0 during the evening hours.
In contrast, on June 13, 2024, the Kp index remained low throughout the entire day. Values were around 0.33 during the early morning and morning hours, rising to a maximum of only 1.0 later in the day, with some intervals even reaching 0.0.
The difference between the two days is reflected not only in peak values but also in the persistence of elevated activity, as multiple consecutive periods of increased Kp values were recorded on June 7.
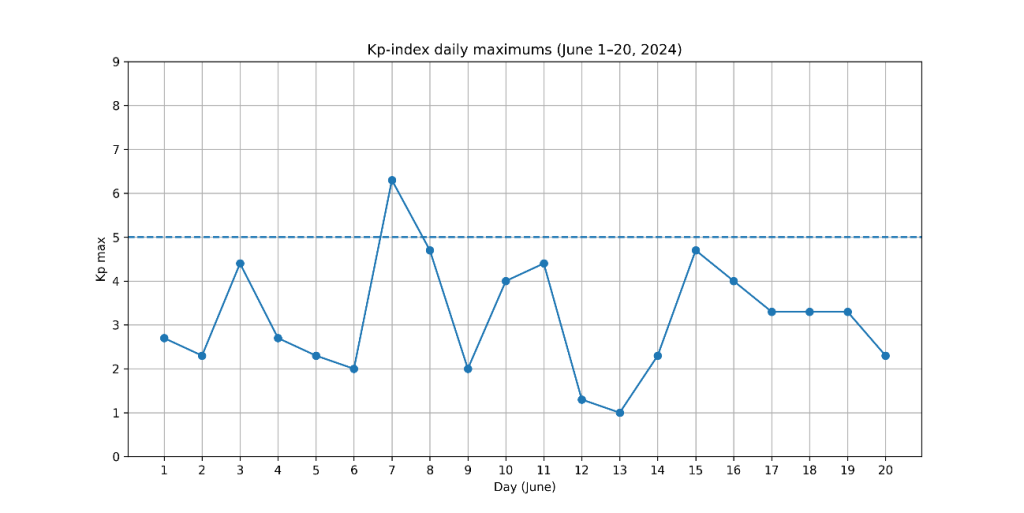
Figure 2: Daily maximum Kp index values between June 1–20, 2024 -The peak on June 7 and the quiet conditions on June 13 are clearly visible Source: own compilation based on GFZ Potsdam archived data
The diagram shows that geomagnetic activity during the examined period exhibited significant variability. A pronounced peak is visible on June 7 (Kp ≈ 6.3), clearly standing out from surrounding days. At the same time, elevated Kp values can be observed both before and after June 13, indicating that the entire period between June 1–20 was characterized by higher-amplitude fluctuations and frequent extreme values.
3. Conclusions
The examined period cannot be attributed to a single isolated event but should rather be interpreted as part of a generally active solar period. Following the geomagnetic activity peak on June 7, elevated Kp values were observed in the subsequent days as well, indicating a fluctuating geomagnetic environment. This suggests that the analyzed flights did not take place under entirely quiet background conditions but within a dynamically changing space weather environment.
Based on the presented data, it is clear that the two flight events occurred under different geomagnetic conditions; however, Kp index values alone do not provide a complete explanation for the observed flight anomalies.
In the next section, we will examine how these environmental differences may manifest in the operation of GNSS-based systems and how they can influence drone flight stability in practice.
Sources: